Closed beta on iPhone · coming to the App Store
Read the chart, not the future.
Chartsure is a training app for reading price charts. Every day you get ten real, anonymised historical charts, about four minutes. You judge what each chart shows right now, say how sure you are, and learn whether your read held up against a documented rule set.
How a daily set works
Ten rounds, three kinds of question, always the same rules. Each chart is a real historical window of 60 candles, scaled so it starts at 100, with no symbol, no date and no price level to recognise. You never see the same chart twice.
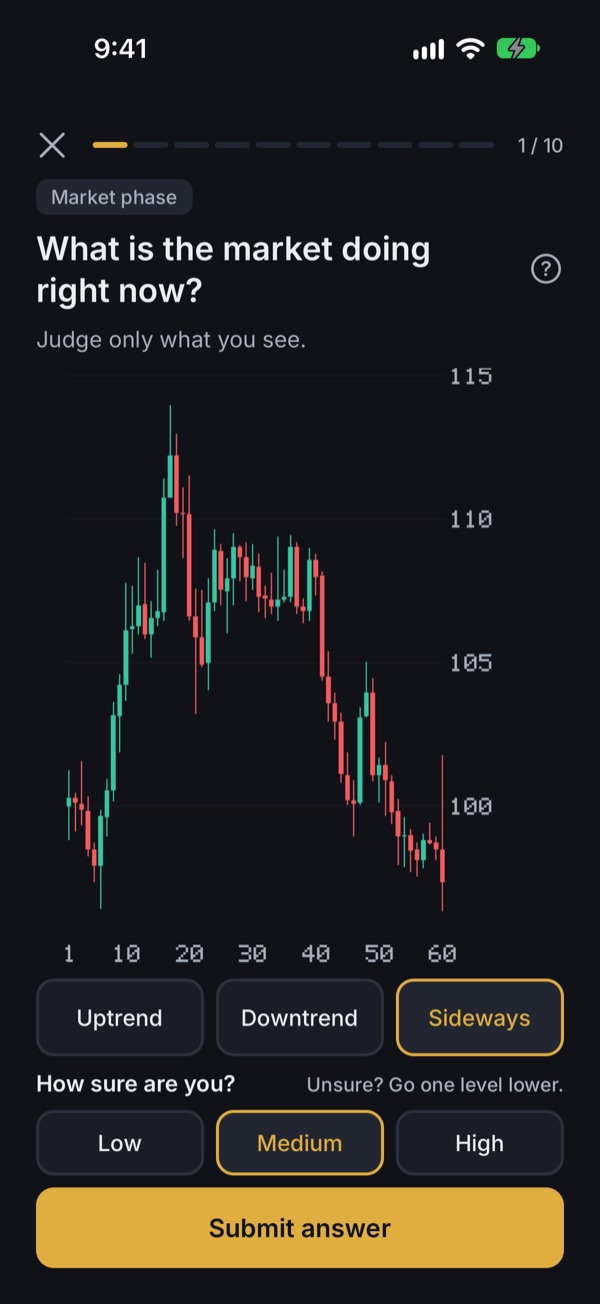
Market phase
What is the market doing right now?
Uptrend, downtrend or sideways, judged at the last candle you see. A fixed rule set decides: swing highs and lows, where the last close sits in the window, how far price has moved. Not an opinion, and never where price goes next.
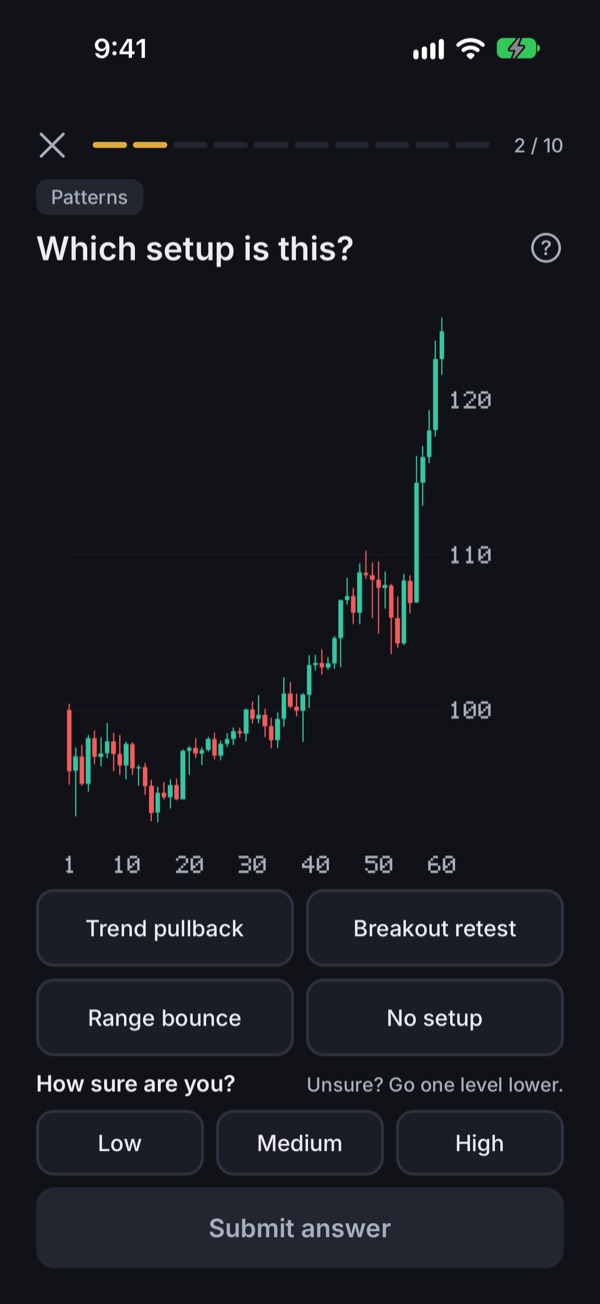
Patterns
Which setup is this?
Trend pullback, breakout retest, range bounce, or no setup. The catalog is the only source of truth: a chart is a setup only if every condition of one type is met. “No setup” is a real answer, and often the right one.
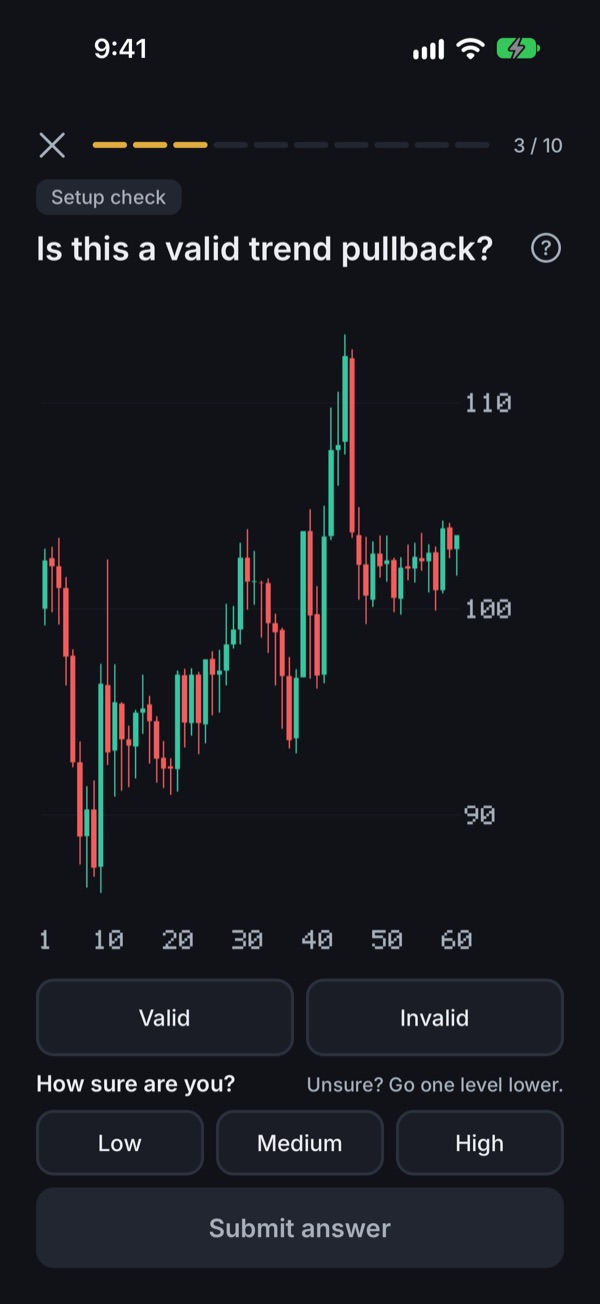
Setup check
Is this a valid trend pullback?
The setup type is given. You decide whether every condition of the catalog is met: trigger in place, structure intact, room to the target. At least four in ten of these charts are invalid, because spotting the near-miss is the skill.
Reading, not guessing
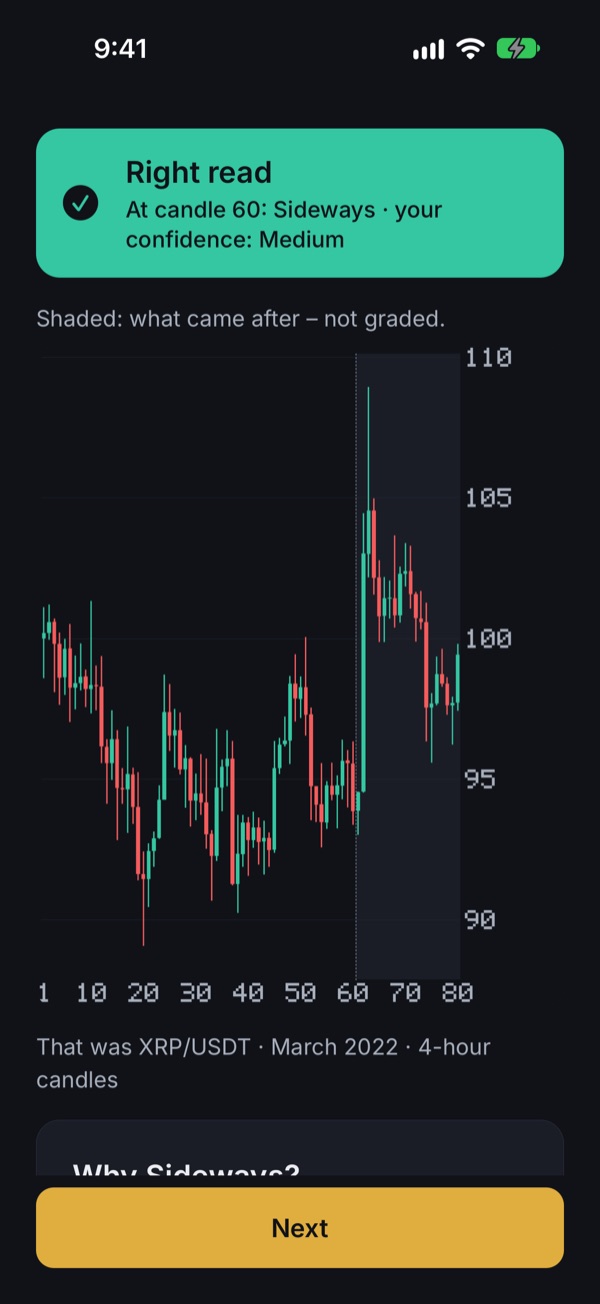
Chartsure grades what the chart shows at candle 60, not what happened afterwards. After you answer, the chart extends by twenty shaded candles so you can see how it went on. That part is context only. It is never graded, and it never changes your result.
Your read can be right and the breakout still comes. Here the market was sideways at candle 60, the read was right, and price broke out right after. Both things are true, and only the first one is your job.
An honest score
Before every answer you pick a confidence: low, medium or high. That makes your score about judgement, not volume.
- Accuracy
- How often your read matched the rule set. Counts 50 %.
- Calibration
- Whether your confidence matched your hit rate. Counts 25 %.
- Discipline
- Whether you said “no setup” when there was none. Counts 25 %.
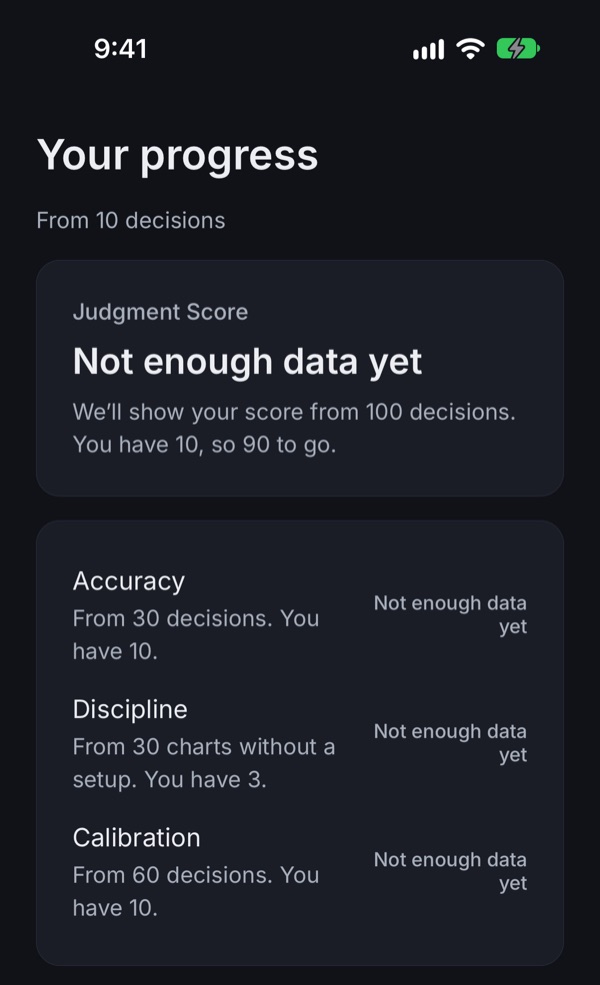
Numbers appear only once there is enough data behind them: accuracy from 30 decisions, calibration from 60, discipline from 30 charts without a setup, the overall score from 100. Until then the app says “not enough data yet” instead of showing a number that could still be luck.
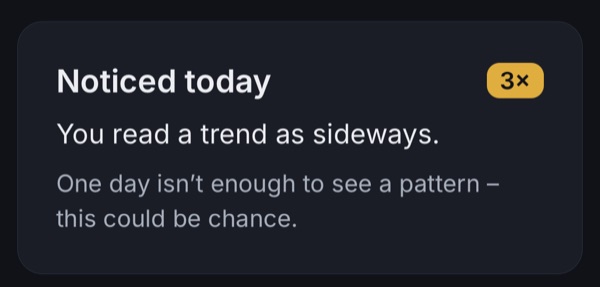
From 30 decisions you also get your pattern: the one confusion you make most, with its count, such as reading a sideways market as a trend. At the end of each set, “Noticed today” shows the mistake of the day and says plainly that one day can be chance.
What you won’t find
Learning, not advice
Chartsure is a training app. Nothing here is investment advice or a signal to trade, and past charts don’t predict future prices. Read the risk notice (German).